1. Getting Started
This section seeks to guide the reader through a number of basic steps.
1.1. Pre-requisites
Before using the SPLAT interface, ensure that you have the following software installed and files downloaded:
Note
If you are already issued the SPLAT learning kit, the following software (except Microsoft Excel) can be accessed in the software folder. If the kit has not been issued to you yet, please fill in the request form , or contact the IRENA person you are in touch with.
Microsoft Excel (64 bit version, to check Checking Excel version)
IAEA MESSAGE tool
A model
SPLAT excel interface
(recommended) CBC solver
The MESSAGE software comes with a free solver called GLPK. If a different solver is needed, it will have to be installed separately. We recommend using the CBC solver for use with the SPLAT interface. Refer to Installing an Alternative (Faster) Free Solver for using alternative solvers like cbc.
1.2. Conventions
User Input Cell
Cells formatted as above (dark font with orange background) are user input cells, where the user is allowed and expected to enter data.
Reserved for Interface
Cells formatted as above (dark font with pale grey background) are cells that are reserved for interface. These cells are populated by macros in the workbook or are calculated cells.
The tabs are organised according to the following conventions:
Indexsheet: lists all the sheets in the workbookMainsheet: where users set the model path, and select countries in the modelYellow tabs: for reviewing and updating basic model inputs
Red tabs: for running a model and extracting results
Grey tabs: utilities available for more advanced users
1.3. First Steps
This documentation uses a simple model for demonstration. You can use an existing MESSAGE model for most of the examples in this documentation.
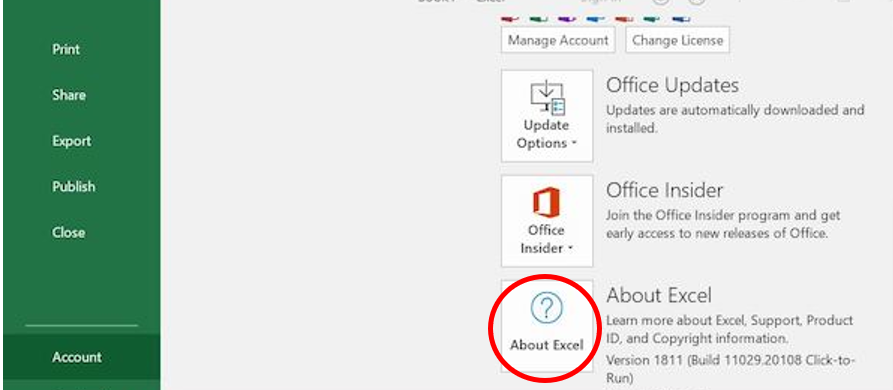
1.3.1. Checking Excel version
The SPLAT Excel interface requires the 64-bit default version of Excel for its main functions. You can check your version of Excel by clicking the menu > > . If you have the older 32-bit Excel, it is recommended to uninstall and re-install your Microsoft Office software with 64-bit selected, or to use a computer with 64-bit software already installed.
1.3.2. Restore model in MESSAGE
In order to run the model using the SPLAT excel interface, you may have to restore the model in MESSAGE once. Refer to the how-to guide on Restoring and opening a model using the MESSAGE interface for instructions on using MESSAGE.
1.3.3. Opening the file
Open the Excel file that starts with SPLAT_Interface_….
When you open the file, you must click (as shown below) for the file to function.
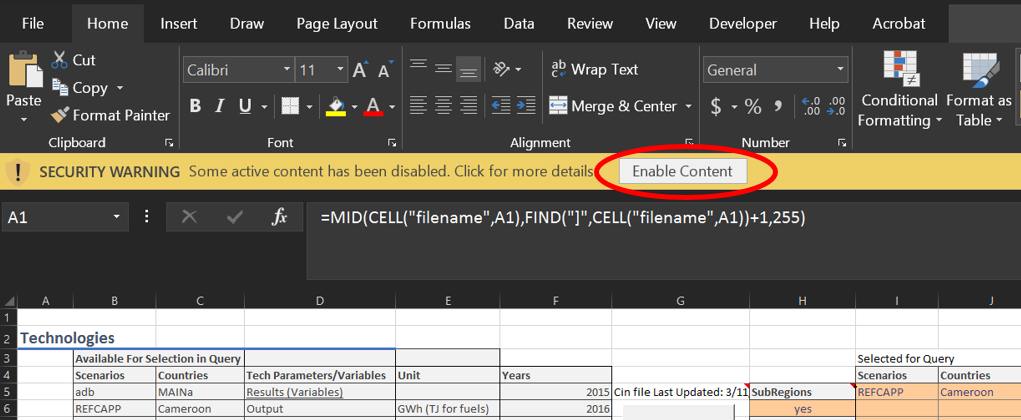
Also, macros must be enabled. Refer to link to enable macros
1.3.4. Checking system’s decimal symbol
The decimal separator of your system must be set to ‘.’ (point) in order for the SPLAT Excel interface to function properly. If it is otherwise, e.g. ‘,’ (comma), please go to Control Panel > Region > Additional settings, and change decimal symbol to ‘.’.
Note
The comma separator is often the default in French windows environments and would have to be changed in order to be able to use the interface. Refer to Change decimal seperator in windows environment.
1.3.5. Linking the interface to your model file
In the
Maintab of the file, make sure the fields Model Folder and Main Region are set correctly as shown below, to reflect the location of the restored MESSAGE model folder on your computer.In the
Subregionssection of theMaintab, choose which country / countries you want to activate, by placing a “1” next to it the orange column, and a “0” next to any other countries.Click the button at the top of the page (this connects the MESSAGE model files with this Excel workbook). The model files are read and loaded into memory in Excel.
You will see a pop-up window which says “2 Countries data loaded in memory” (as shown below); press .


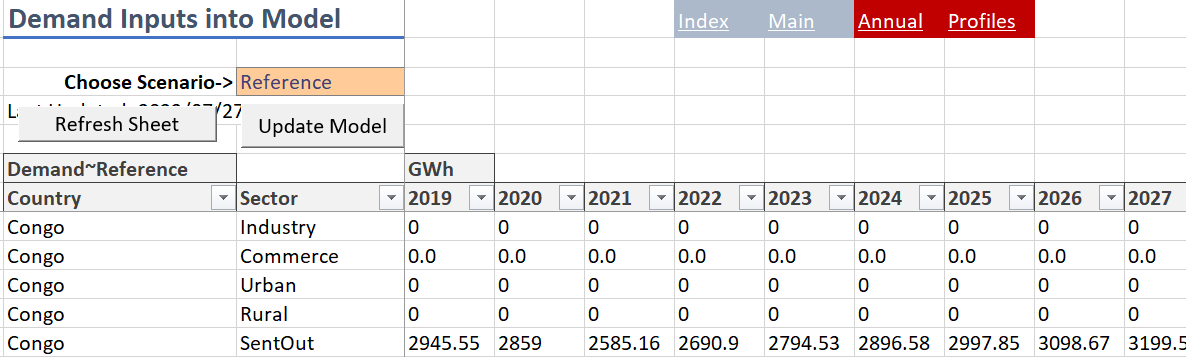
1.3.6. Viewing model input
The SPLAT Excel interface allows a user to see the input data stored in SPLAT-MESSAGE models.
In any of the yellow tabs, choose the scenario from the dropdown list in cell C3.
Click on , the data stored in the model will show in the table.
This process works the same way for all the yellow tabs (Demand, Transmission, Distribution, etc.) of the SPLAT Excel Interface. You can also refresh all sheets in these tabs by clicking the in the Main tab.
Caution
If you have emptied the cells under the table header, pressing the ‘Refresh sheet’ will cause an error. This occurs because the underlying macro code is unable to identify the start cell to start pasting the requisite model data. If you come across this error, click ‘end’ > Reload global > write some simple single alphabet in the cell right under the first cell of table header > refresh sheet.
Note
Keep in mind that the “adb” (Application Database) scenario contains all of the basic data in the model. Choosing another scenario will show only the data that is different in that scenario. So, if you choose a scenario and the data is blank, then it means it has the same data as the “adb”.
1.3.7. Running the model
After linking your model to the interface file in the Main tab, you can run your SPLAT model using the ReportGen-Annual tab.
1. Select the correct scenario and country combination that you want to run. To run the model for entire continent, select all the countries and “MAINa” in Subregions/Countries.
2. Select the preferred option (with or without interconnections between subregions) under Run Options (Subregions).
For a single county model, select Separate Subregions.
For a multi-country model, Separate Subregions or Interconnected can be selected depending on the scenario narrative for interconnection between countries.
In this example we select Interconnected` option.
Select the correct option under the “Run” categories. The categories correspond to the same options in the MESSAGE “Run” menu: Mxg = Matrix Generator; Opt = Optimisation; Cap = Calculator program (Cap) file creation; All = perform all of the above. There are three different options provided in the interface for CPLEX, CBC and GUROBI depending on which solver you have pre-installed. If you are a new user, please install and use CBC (Installing an Alternative (Faster) Free Solver).
Press the button. You should see the black MESSAGE window appear and begin to run.

1.3.8. Extracting the results
1.3.8.1. Use the ReportGen tab
The ReportGen-Annual tab is also where you can pull in the results of the model that you just ran.
Select the scenario(s), country(s), variable(s) and year(s) combination that you want to view the results of. Please ensure that your desired scenario has been loaded in the excel memory. If it does not appear in the dropdown list, please go again to ‘Main’ tab and mark the desired scenario ‘1’ and press ‘Reload Global’ button.
Select the output format and enter output path (if applicable) under
Results Destinationsection.Click on (red circle in picture below). If on this sheet is selected, you should see raw results appear on the sheet when the process is finished. If csv is selected, then the results will be written to a csv file at the specified location. If the location doesn’t exist then there will be an error message. The csv option is more convenient when working with large set of results, and they can be linked to other pivot tables in Excel or other software such as PowerBi or Tableau.

1.3.8.2. Update the results charts
You can find the yearly result charts in the red sheets: Capacity, Output, New Capacity, CO2, and Costs.
Important
Please be sure to check that the correct scenario and country are chosen at the top of the table.
Right-click anywhere in the table on the worksheet, and select from the options. These charts need to be updated every time you pull in new results.
